


These Canadian infrastructure stocks are set to do well if history is any indication
Ryan Bushell | November 10, 2020 | SmallCapPower: Life is cyclical. There are short cycles, like a single day, and longer cycles like a lifetime. Financial markets are no different, however nearly all the attention focuses on the mid-length market cycles that accompany the business cycle. An endless amount of effort is spent trying to analyze and predict these cycles with the hope of timing the market. Of course, there are also powerful longer-term cycles, but they receive far less attention from investors with shorter-term incentives and attention spans.
The chart below is from a recent article authored by Lyn Alden detailing the most recent 100-year debt cycle: (Source US Treasury and US Federal Reserve via lynalden.com)
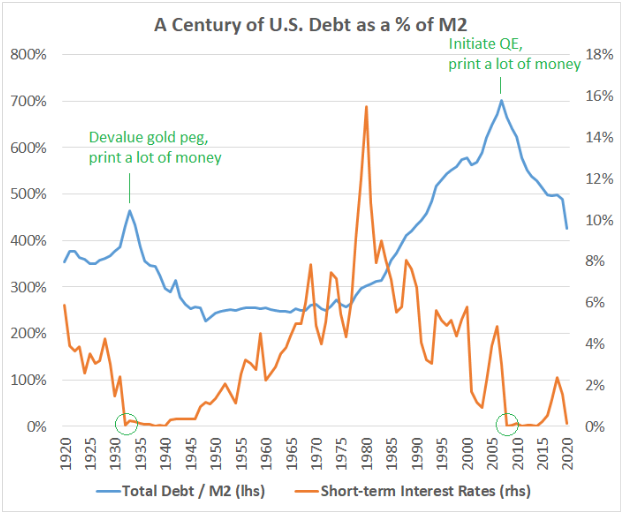
In my opinion the chart above is fascinating and, although it is US centric data, the pattern is similar for most Western nations. The chart shows total debt as a percentage of total money supply (blue line) in the US peaked in the early 1930’s soon after the central bank took interest rates to zero (left green circle) in the aftermath of the legendary stock market crash of 1929. Similarly, the amount of total debt as a percentage of total money supply peaked around 2011 after the central bank took interest rates to zero (right green circle) following the 2008 global financial crisis induced market crash. As you can see the debt peaks are amazingly similar and occurred nearly 80 years apart. In both cases the debt (numerator) was not repaid in the 10-year periods that followed, instead the money supply (denominator) was increased dramatically in both cases by printing money out of thin air.
The thought of central banks printing money so that governments can then spend far more than they generate in tax revenues for an extended period seems very worrying/irresponsible/unprecedented in the moment, but it is logical and has repeated throughout history in different forms dating all the way back to ancient Greece. Following decades of system-wide debt accumulation and declining interest rates, governments and central banks are left with a difficult choice. They can choose austerity (cut spending, repay as much debt as possible and encourage citizens to do the same), or they can print money to add to the system, making the debt easier to repay down the road because there are more dollars in circulation.
Consider this simple example: You have two glasses of water. One is almost full, and the other is nearly empty. How do you balance them out? If you said “pour water from the full glass into the empty one until they come into balance” you are thinking in terms of a zero-sum game, where resources are constrained to only the water in the two glasses. This is how most of us are programmed to think… but what if you just went to the tap to fill up the empty glass?
In the example above the first scenario is the austerity route. Governments raise tax revenues, cut spending, and use the difference to pay down debt, thereby reallocating the existing resources in the system. This can work if debt levels are contained, but the potential problem arises when the debt in the system has become so large that they would risk a significant economic collapse (depression), and thus a collapse in tax revenues, before the books become balanced via years of austerity. The second scenario involves creating more money (turning on the tap) and distributing it to those in need via spending and/or tax cuts to boost the economy. Eventually the debt to be repaid becomes manageable with increasing amounts of less valuable dollars in the system. Essentially this process buys time and rebalances the resources in the system. The key here is that debt amounts remain static while money supply grows quickly.
If we revisit the 1930’s we can see evidence of both approaches in action. Most people understand that the stock market crash of 1929 set the stage for the Great Depression, but few actually know why. The reality in 1929 was that the economy was over-leveraged and the abrupt drop in equity values set off the cascading wave of bankruptcies discussed above. Central banks and governments did not react fast enough with stimulus and thus the financial system was forced to cope with constrained resources to repay debts that had outgrown the underlying economy. Eventually FDR was elected in 1933 and enacted an ambitious set of legislative acts beginning in 1935 aimed at rebooting the US economy primarily through infrastructure spending. A policy that came to be known as the New Deal.
The New Deal infrastructure spending was not universally accepted during its time, in fact many fiscal conservatives vigorously criticized it as socialism and warned it would harm the long-term interests of the economy. It was also not universally responsible for the recovery either. Prior to enacting the more famous infrastructure spending, the FDR administration, along with the Federal Reserve, changed the value of the dollar when priced in gold (the gold standard). Few people I’ve talked to know that between 1933 and 1934 the dollar was devalued by ~28% (from 1/25th of an ounce of gold per dollar to 1/35th of an ounce) AND interest rates were reduced to zero. This set the stage for government spending on infrastructure, WW2 and the Marshall Plan that followed. FDR’s stimulative New Deal is now widely credited for ending the Depression, but it would not have been possible without dramatically increasing the money supply.
By now you are likely recognizing some similarities to the situation we find ourselves in today. If we apply history to the current situation, 2008 could be viewed as our 1929. Learning from our past mistake we printed the money faster in response to our crisis such that we avoided the severe Depression that befell our predecessors, but the money we printed between 2008 and 2014 did not fully make its way into the general economy. We seem to be having our WW2 moment with the COVID 19 pandemic. Following a decade of loose monetary policy, we are now at the point where the money is being printed and distributed in even larger quantities and more directly into the system. It is crucial that we prepare for the prospect of currency devaluation and/or inflation by avoiding bonds and cash while focusing our equity investments in the areas likely to benefit from government stimulus measures.
As mentioned in my last article I believe a wave of infrastructure spending is coming in North America on the back of this pandemic that will have a particular focus on reshaping and expanding the electricity grid. Renewables are likely to see the most growth, but those stocks which make up 10% of Newhaven portfolios, have already moved up significantly. As renewables grow natural gas will grow in tandem given the intermittent nature of renewable generation and the physical constraints of battery storage/production. Natural gas prices are sitting near 3-year highs and North American demand hit a new all-time high this summer despite a significantly impaired economy due to COVID 19. Canadian natural gas infrastructure providers are overlooked despite strong and improving fundamentals. TC Energy, Pembina Pipeline, Altagas, and Enbridge combined represent ~15% of all Newhaven portfolios. Each of these companies have significant cross-border natural gas infrastructure businesses, carry an average dividend yield in excess of 5.5%, and are an essential part of delivering energy to a continent demanding more every year. The combination of a pandemic and a technology stock frenzy has left these companies in the discount bin… they are simply too essential to stay there for much longer.
To read our full disclosure, please click on the button below:
